THE WORLD OF LUXURY EXPERIENCE
Grande Asset Hotels and Property Public Company Limited
THE WORLD OF LUXURY EXPERIENCE
Grande Asset Hotels and Property Public Company Limited
THE WORLD OF LUXURY EXPERIENCE
Grande Asset Hotels and Property Public Company Limited
THE WORLD OF LUXURY EXPERIENCE
Grande Asset Hotels and Property Public Company Limited
THE WORLD OF LUXURY EXPERIENCE
Grande Asset Hotels and Property Public Company Limited
THE WORLD OF LUXURY EXPERIENCE
Grande Asset Hotels and Property Public Company Limited
THE WORLD OF LUXURY EXPERIENCE
Grande Asset Hotels and Property Public Company Limited

AT A GLANCE
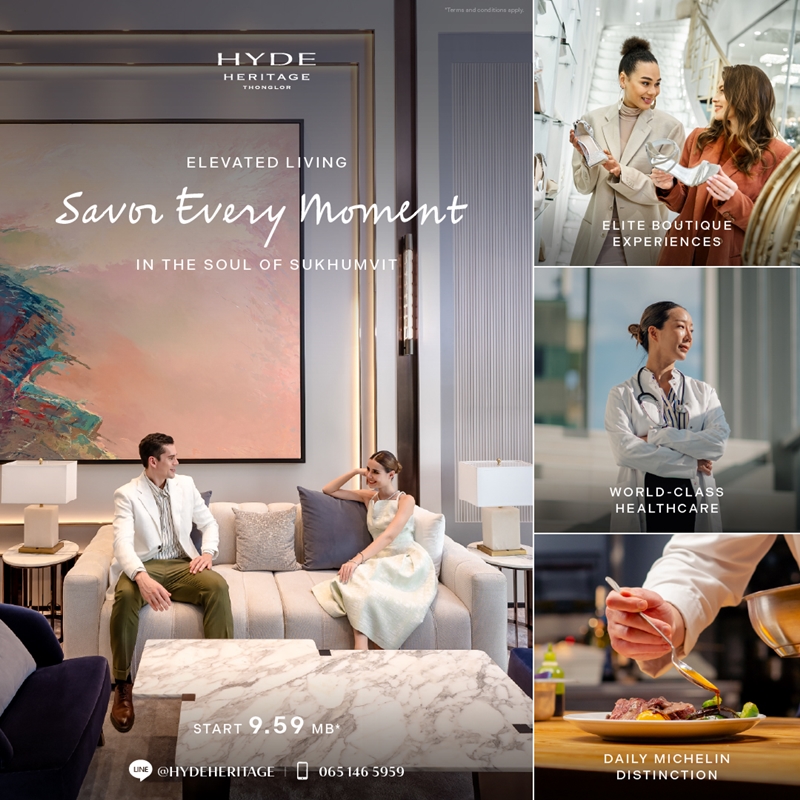
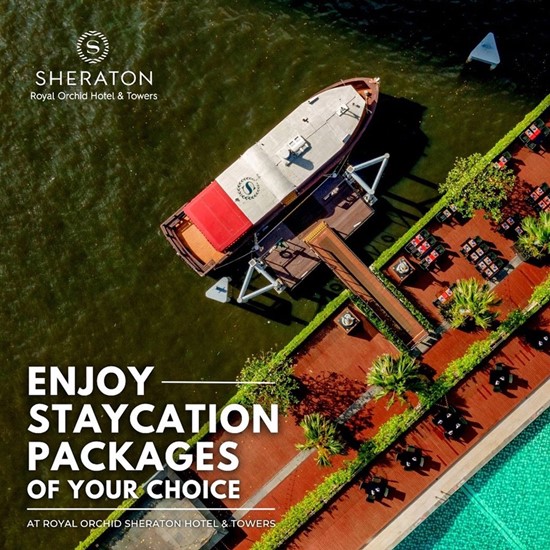
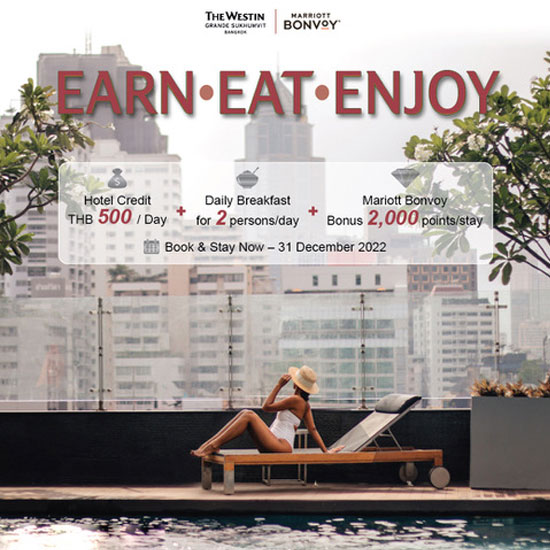
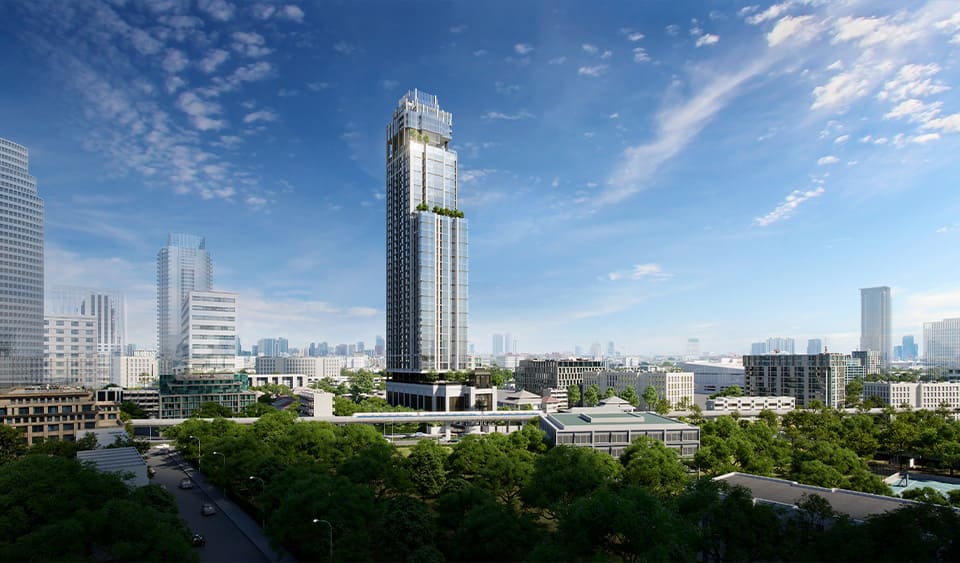
The Company focuses its business and property development. For the investment in a hotel, the Company will focus mainly on the investment in internationally and globally managed brand of four to five-star hotels such as Marriott International, and Hyatt International Corporation. These five-star hotels aim to target medium to high-end local and foreign customers, tourists with high purchasing power. For hotel investment in Bangkok Metropolitan, the Company invests in prime location of the business area and in Bangkok, for example, The Westin Grande Sukhumvit and The Royal Orchid Sheraton Hotel and Towers which are managed by Marriott International and Hyatt Regency Bangkok Sukhumvit at Sukhumvit Soi 13 which managed by Hyatt International Corporation. The Company also invested selectively in beachfront hotels that are located in the city that offer various attractions to tourists such as the Sheraton Hua Hin Resort and Spa located in Cha-am, Petchaburi and Sheraton Hua Hin Pranburi Villas in Pranburi which both hotels managed by Marriott International.
Explore More